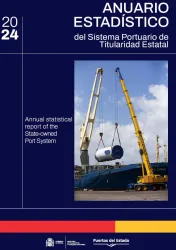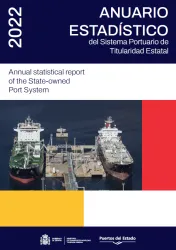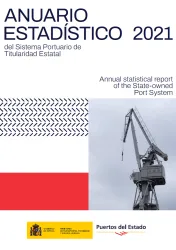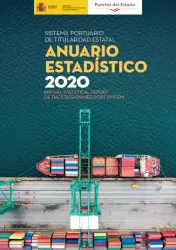
Anuales
Cuadro de Mando Anual
Anuarios Estadísticos de Puertos del Estado
Memorias de las Autoridades Portuarias
Selecciona la Autoridad Portuaria que desees pinchando en el punto rojo. Puedes cambiar de año seleccionándolo y pulsando "Filtrar".
Nota metodológica
- Denominación: Anuario estadístico del Sistema Portuario de Titularidad Estatal.
- Servicio responsable: Departamento de Estadística del Organismo Público Puertos del Estado (Ministerio de Transportes y Movilidad Sostenible del Gobierno de España).
- Ámbito geográfico: Datos de todas las Autoridades Portuarias que gestionan los puertos de interés general del estado español.
- Objetivo: Presentación de la información anual del tráfico portuario de mercancías, de contenedores, de buques y de pasajeros de los puertos españoles de interés general. Así mismo, se incluye información sobre las características de los puertos.
- Formato: Informe realizado en PDF y con la posibilidad de descargar los datos en XLSX.
- Fuente administrativa de los datos: Para la elaboración del Anuario Estadístico se utilizan los datos incluidos en las Memorias Anuales de las Autoridades Portuarias. Dichos datos, a su vez, provienen de los manifiestos de carga, declaraciones sumarias de depósito temporal, manifiestos de pesca, declaraciones únicas de escala y otros documentos utilizados para el cálculo de consumo de suministros y la facturación de las tasas correspondientes.
- Periodicidad: Anual.
- Procedimiento: Las Autoridades Portuarias envían anualmente sus Memorias a Puertos del Estado, que se encarga de recopilar, procesar, validar, agregar y difundir toda la información mediante el Anuario Estadístico.
- Variables de estudio: Toneladas de mercancías y equipamientos. Número de Unidades de Transporte Intermodal. Número de contenedores (en unidades y TEUS). Número y unidades de arqueo bruto de buques. Número de pasajeros. Número de automóviles (en régimen de pasaje y de mercancía).
- Difusión: Inserción en la página web de Puertos del Estado y difusión selectiva de la información mediante correo electrónico, en octubre de cada año.


