4.1. Evolución histórica del tráfico portuario Port traffic development
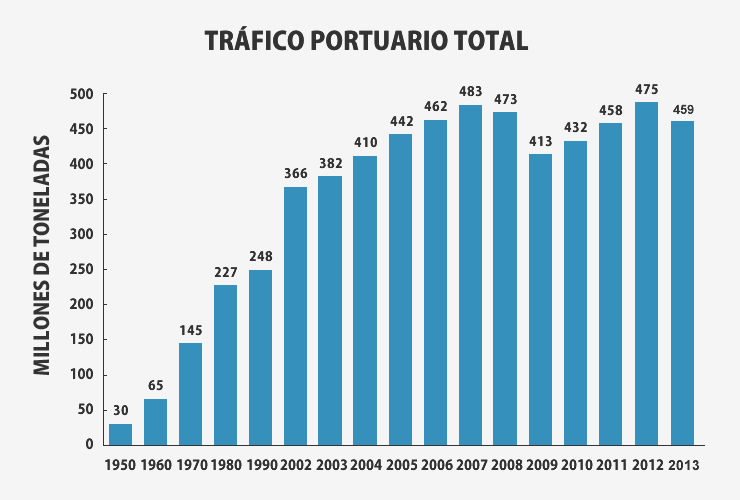
Durante el año 2013 se han movido, en el conjunto del Sistema Portuario de Titularidad Estatal, 458,9 millones de toneladas de mercancías, 16,3 millones menos que en 2012, lo que supone un descenso del -3,44 %. Bahía de Algeciras mantiene el primer puesto con 91,1 millones de toneladas, experimentando un incremento del 2,5%, respecto a 2012.
La evolución histórica del tráfico portuario se refleja en el siguiente gráfico:
During 2013, in the Spanish State-Owned Port System as a whole, a total of 458.9 million tonnes of goods were handled, which is 16.3 million less than in 2012, or a reduction of a -3.44 %. Bahía de Algeciras is still in the lead with 91.1 million tonnes, a increase of 2.5 % compared to 2012.
Historic evolution of port traffic is shown in the next graphic:
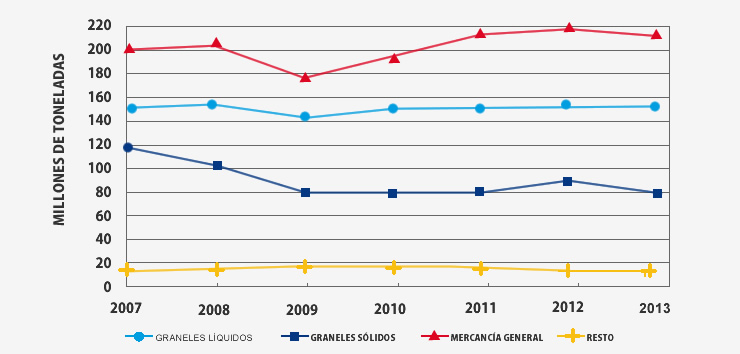
En los últimos siete años la distribución del tráfico portuario total ha sido la siguiente:
En millones de t.
Distribution in the last seven years has been as fllows:
Millions of tons.
| 2007 | 2008 | 2009 | 2010 | 2011 | 2012 | 2013 | |
| Graneles líquidos / Liquid bulk | 150,4 | 154,0 | 143,5 | 149,2 | 150,8 | 153,4 | 152,0 |
| Graneles sólidos / Dry bulk | 116,9 | 101,4 | 79,1 | 78,7 | 79,3 | 88,6 | 80,3 |
| Mercancía general / General | 200,7 | 203,7 | 176,6 | 190,8 | 213,7 | 219,1 | 213,4 |
| Pesca capturada / Fish captures | 0,2 | 0,2 | 0,3 | 0,2 | 0,2 | 0,2 | 0,2 |
| Avituallamiento / Supplies | 11,0 | 10,8 | 10,5 | 10,2 | 11,1 | 10,4 | 9,9 |
| Tráfico Interior / Local traffic | 4,0 | 3,7 | 3,1 | 3,4 | 3,0 | 3,5 | 3,1 |
| TOTAL / TOTAL | 483,1 | 473,8 | 413,0 | 432,5 | 458,0 | 475,2 | 458,9 |
Entre los años 2012 y 2013 se han producido las siguientes variaciones:
Variations 2012-2013 are shown in the next table:
| TRÁFICO PORTUARIO PORT TRAFFIC |
DIFERENCIAS VARIATIONS |
|||||
| 2012 | 2013 | 2012-2013 | ||||
| Mill. T. | % | Mill. T. | % | Mill. T. | % | |
| Graneles líquidos / Liquid bulk | 153,4 | 32,3 | 152,0 | 33,1 | -1,4 | -0,9 |
| Graneles sólidos / Dry bulk | 88,6 | 18,6 | 80,3 | 17,5 | -8,3 | -9,4 |
| Mercancía general / General | 219,1 | 46,1 | 213,4 | 46,5 | -5,7 | -2,6 |
| Pesca capturada / Fish captures | 0,2 | 0,1 | 0,2 | 0,1 | -0,0 | -4,2 |
| Avituallamiento / Supplies | 10,4 | 2,2 | 9,9 | 2,2 | -0,5 | -5,3 |
| Tráfico Interior / Local traffic | 3,5 | 0,7 | 3,1 | 0,7 | -0,4 | -10,1 |
| TOTAL / TOTAL | 475,2 | 100,0 | 458,9 | 100,0 | -16,3 | -3,4 |